Attendance Explorer
Tableau, tabcmd
Funded by Attendance Works
*All screen shots use artifically generated data using Python/pandas/Jupyter
Tableau, tabcmd
Funded by Attendance Works
*All screen shots use artifically generated data using Python/pandas/Jupyter
See this visualization live at: Attendance Explorer
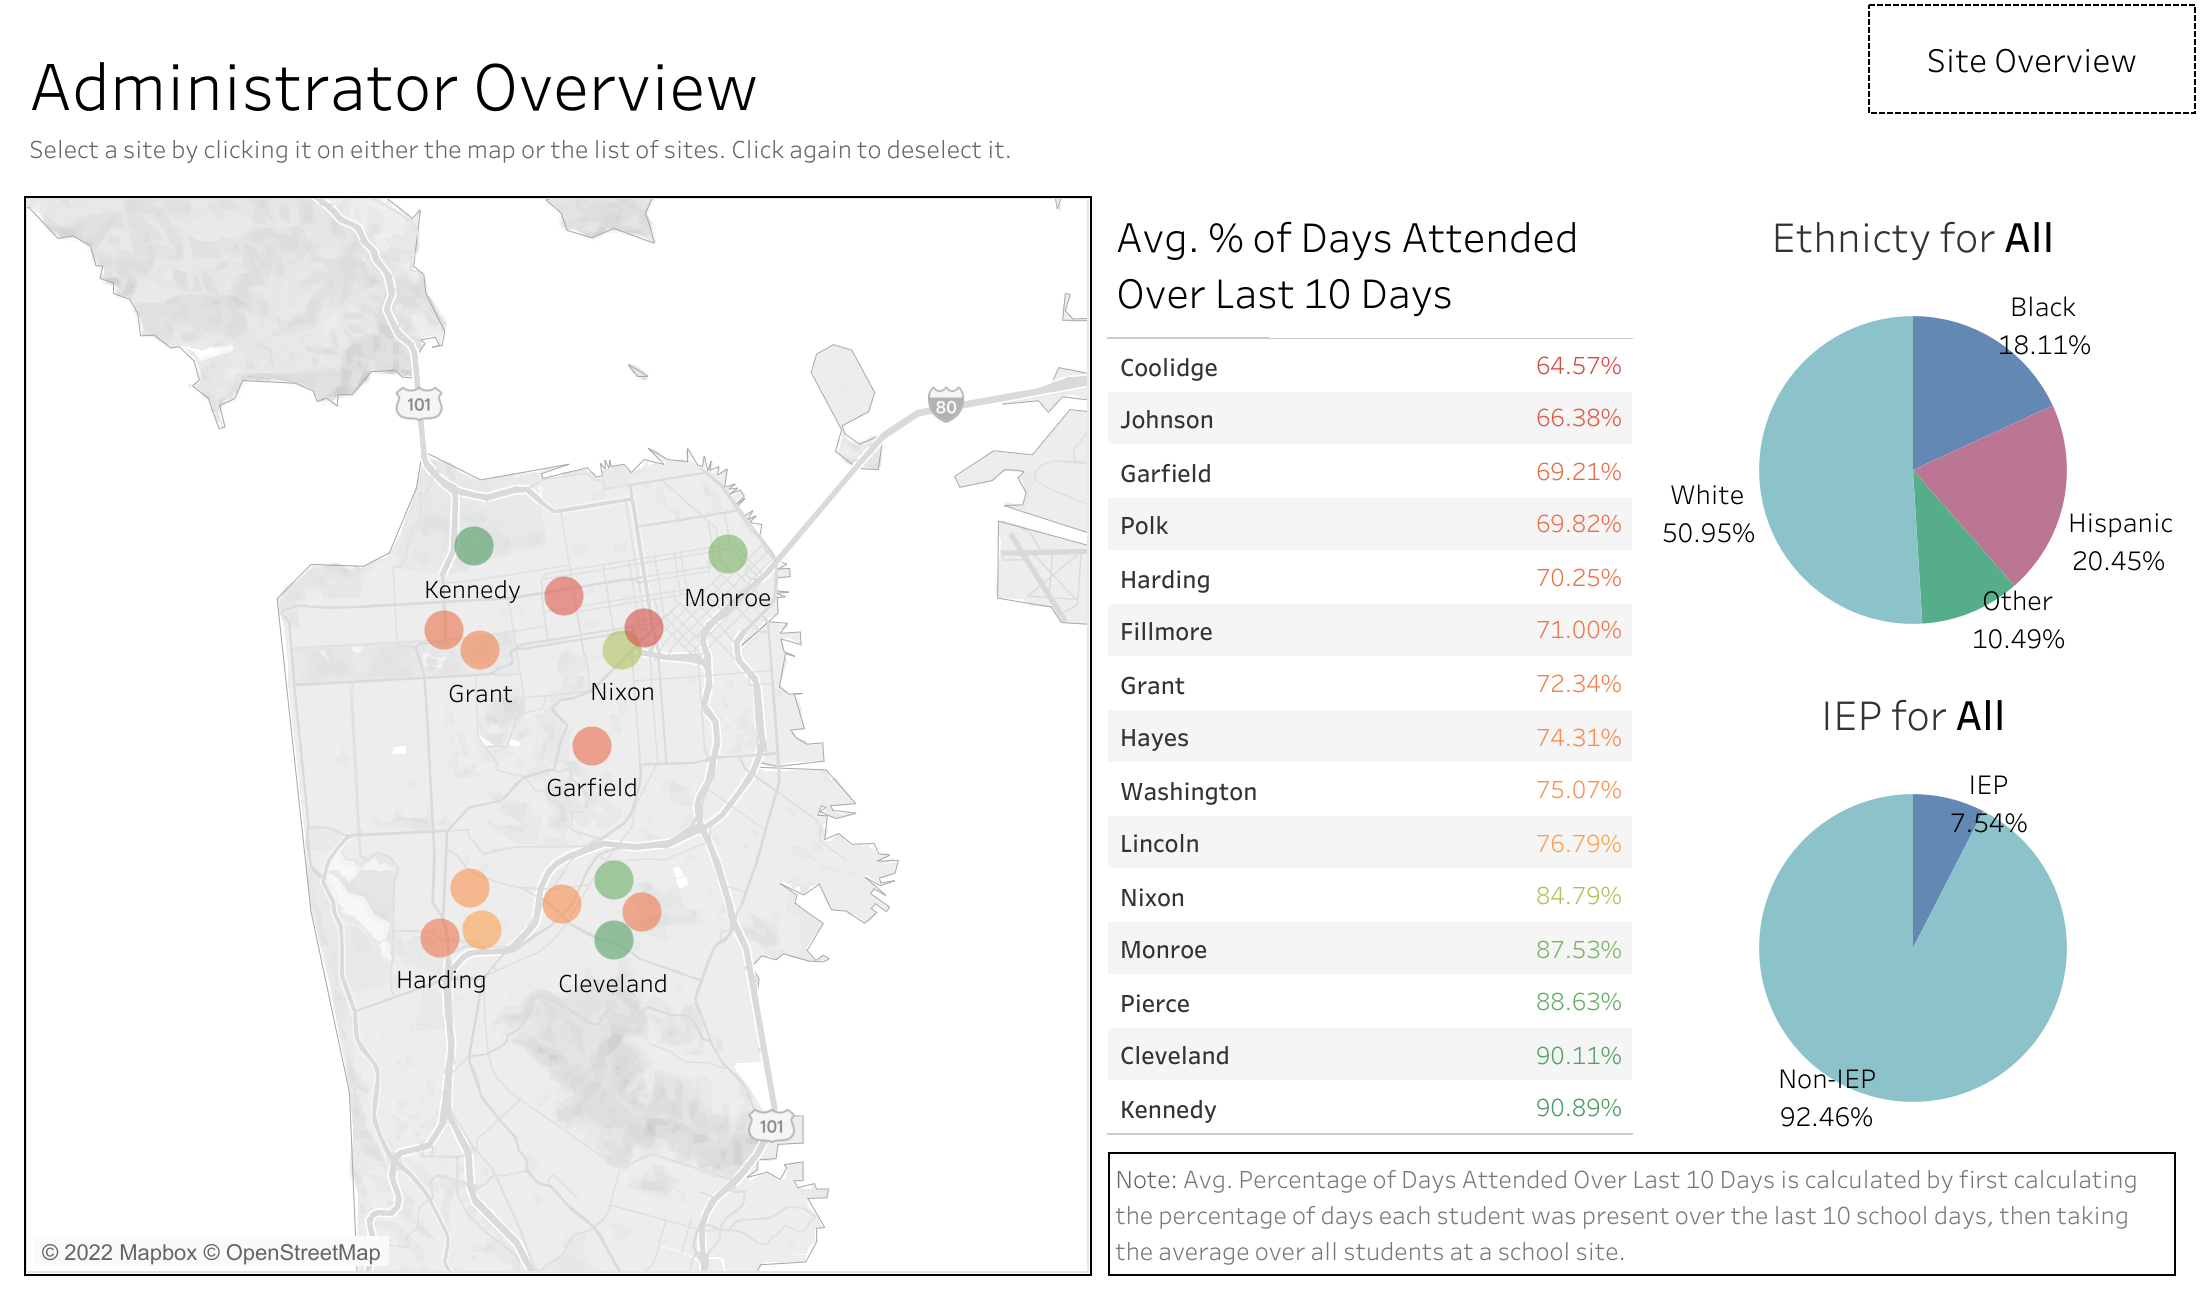
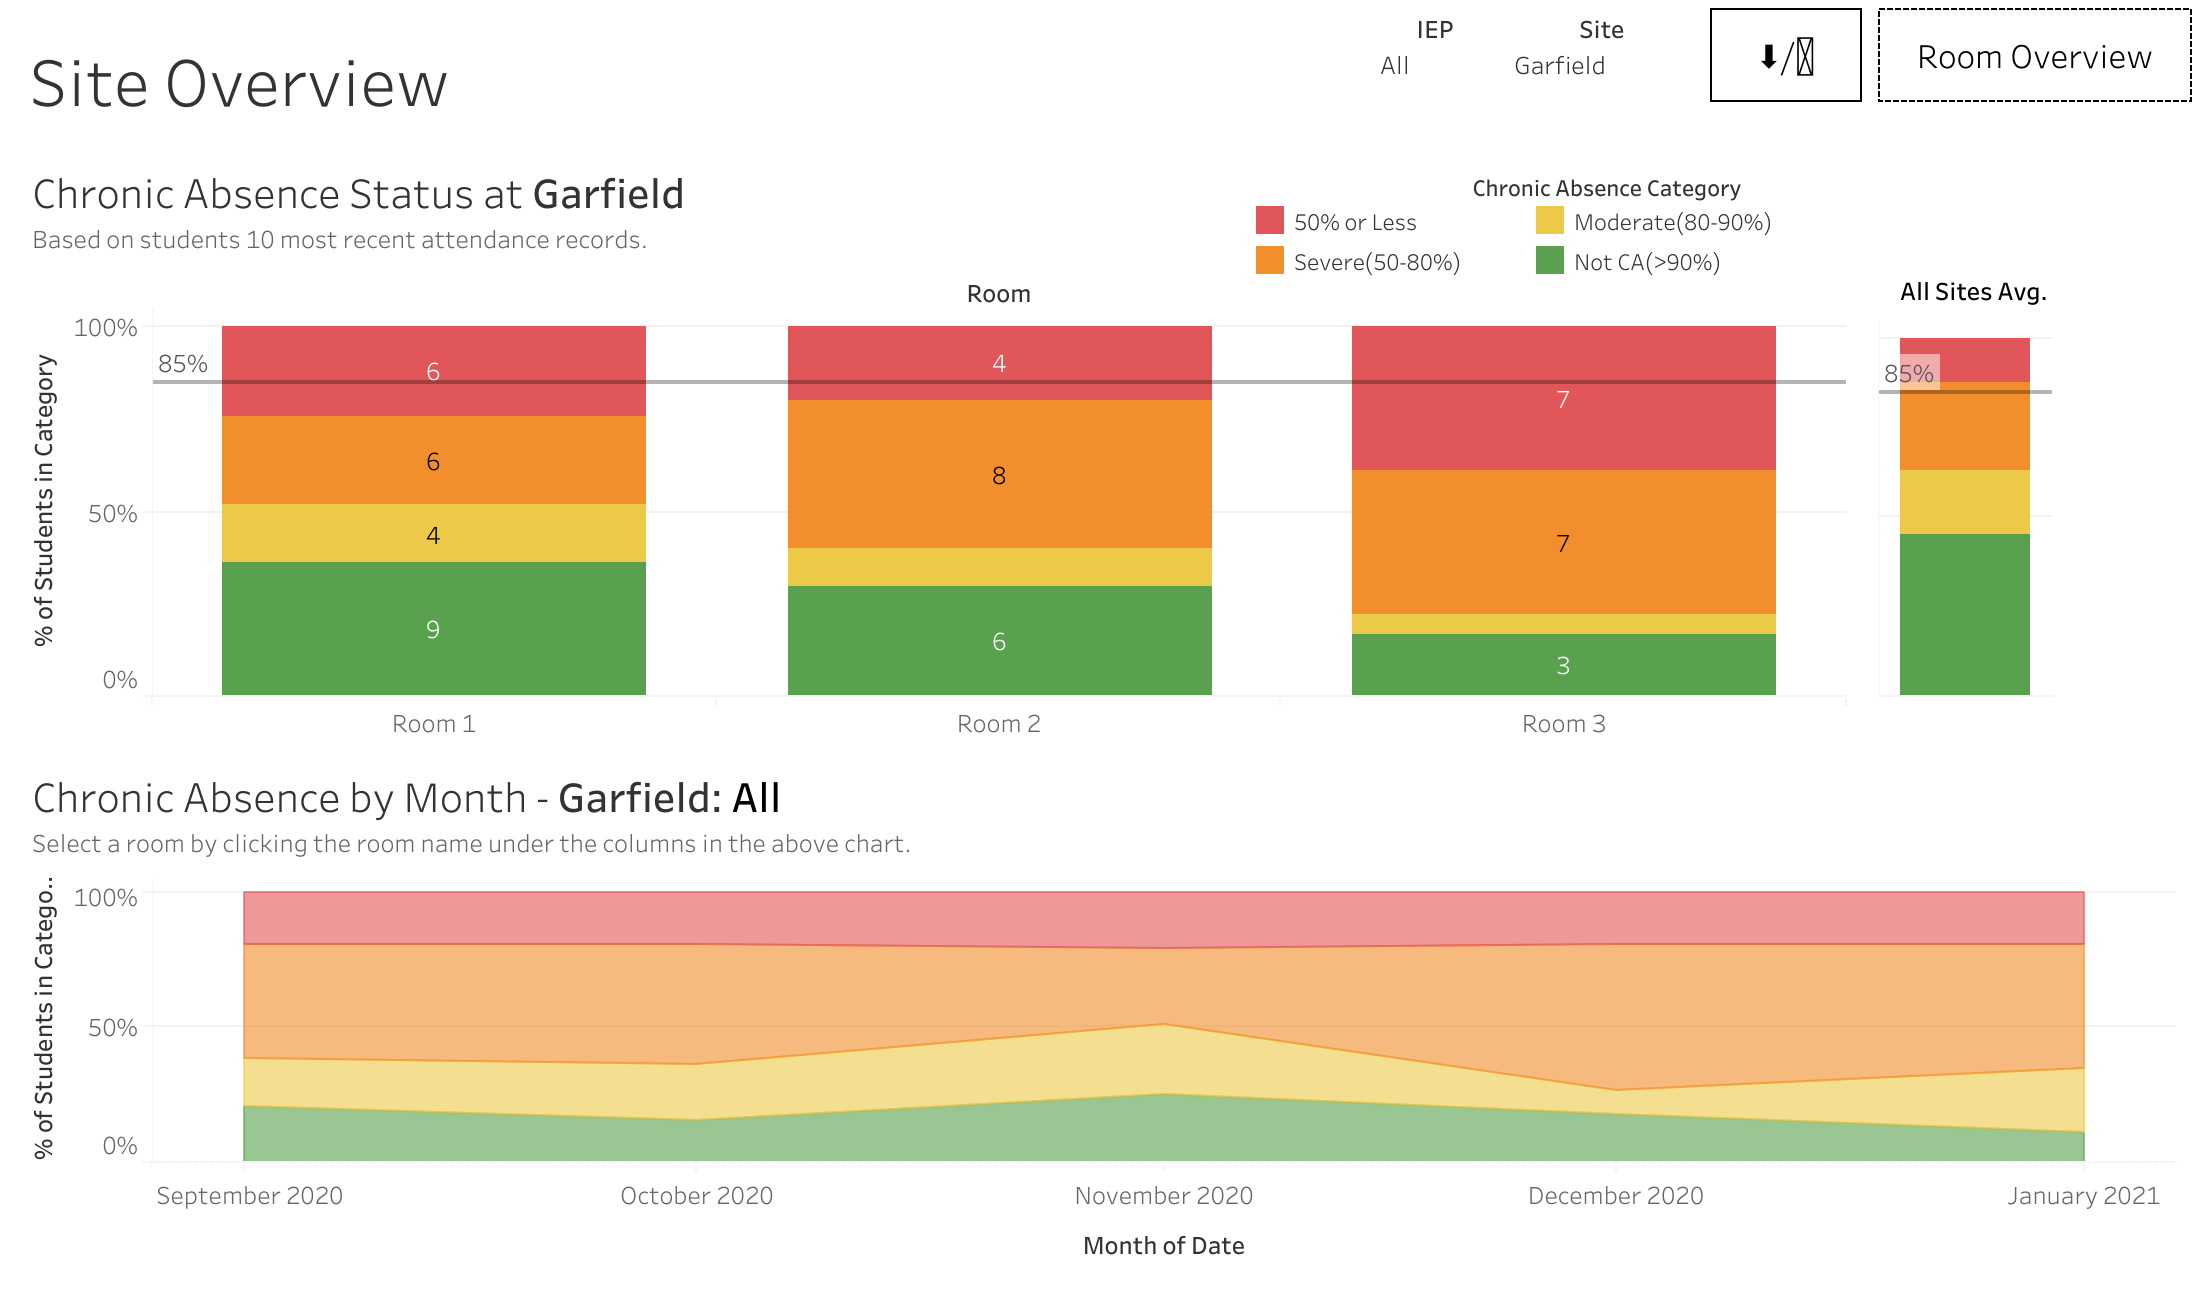
This attendance dashboard was developed for a school district that wanted to enable administrators, principals, and teachers to see attendance data for students at each of their sites.
The dashboard was developed to allow each level of staff to drill down from their respective levels all the way to individual student attendance records.
A final report focusing on an individual student allows that sheet to be shared at parent teacher meetings.
Automatic PDF generation of reports was accomplished via tabcmd.